
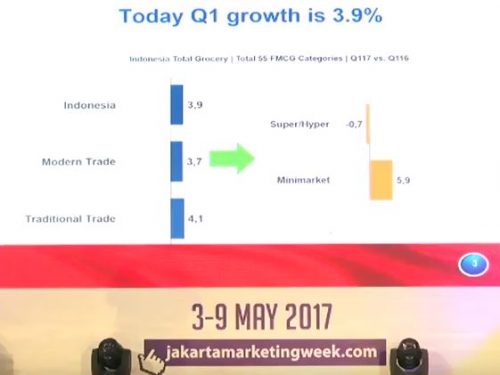
Indonesia’s FMCG sales value (total 55 categories) grew 3.9% year-on-year during the first quarter of 2017, said Roy Mandey, chairman of the Indonesian Retail Merchants Association (Aprindo), at Jakarta Marketing Week (3-9 May 2017). FMCG sales value grew 10.9% in the same period a year ago. He did not mention the source of the Q1 2017 data but is likely to come from Nielsen Retail Audit.
FMCG sales growth moderating
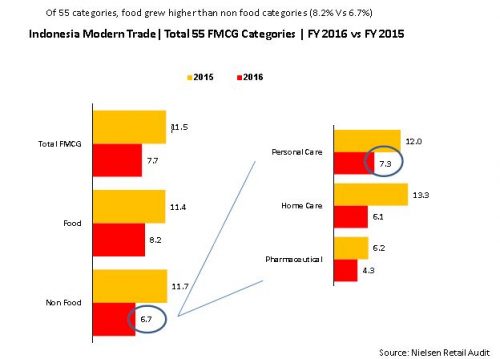
Over a three-year period from 2014 to 2016, Nielsen Retail Audit data shows growth in Indonesia’s FMCG sales value (55 categories) has moderated. The FMCG market in 2015 grew by 11.5% year-on-year, falling subsequently to 7.7% year-on-year in 2016, according to data from the Alfamart year-end corporate presentation slides.
Non-food driving growth
Nielsen data shows non-food contributed most of the growth in 2016, of which personal care, home care and pharmaceutical sales value rose respectively by 7.3%, 6.1% and 4.3%, still a slowdown from a year ago.
Kantar Worldpanel data substantiated Nielsen’s claim in home care. According to Kantar data, which tracks around 5,000+ households in Indonesia, home care sales value in 2016 fell compared to 2015 but personal care surprisingly saw higher growth, up 12% in 2016 compared with a 8% growth in 2015.
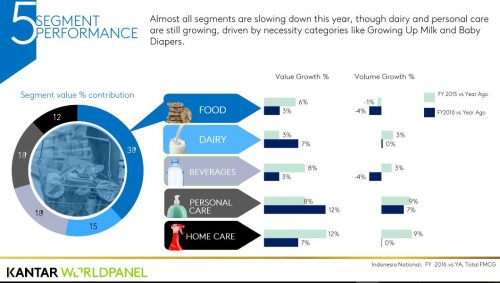
Looking at the food sector (food, dairy and beverage), both Nielsen and Kantar data reveals strong dairy sales by value but slowdown has affected food and beverages. The Kantar Worldpanel slide did not disclose the breakdown for food, dairy and beverages.
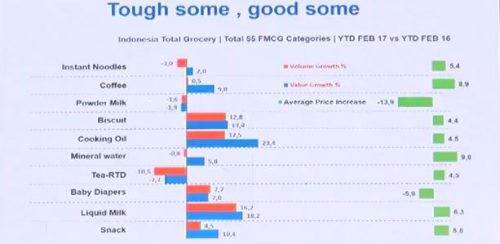
The presentation by the head of Aprindo, Roy Mandey, reveals how the various segments performed year to date (YTD) February 2017 versus YTD 2016 citing Nielsen total grocery (55 FMCG categories).
It is apparent value is driving growth as manufacturers passed on rising cost to consumers to mitigate the effect of inflation. Inflation in 2016 stood at 3.02%, down from 3.35% in 2015, the lowest since 2012, according to the Central Statistics Agency (BPS). Food inflation in 2016 stood at 5.69%, up from 4.93% in 2015 but down from 10.57% in 2014.
Categories seeing decline
The consumption volume of instant noodle fell but value grew marginally, a sign that consumers are shifting to more expensive products as they go for quality than quantity. This is in line with the premiumisation efforts by the instant noodle players to upgrade their products including adding real meat pieces.
Mineral water sales volume fell 0.8%, while value grew 5.8% but with a high 9.6% average price increase. The premiumisation effort is strong within mineral water as companies introduce products with a higher pH level and more convenience packaging.
RTD tea was the biggest decliner with volume and value YTD February 2017 down by 10.5% and 7.2%, respectively. This is a big surprise.
In YTD June 2016 versus YTD June 2015, RTD tea was a star performer, up by around 20% in value and volume, as with mineral water, according to Nielsen.
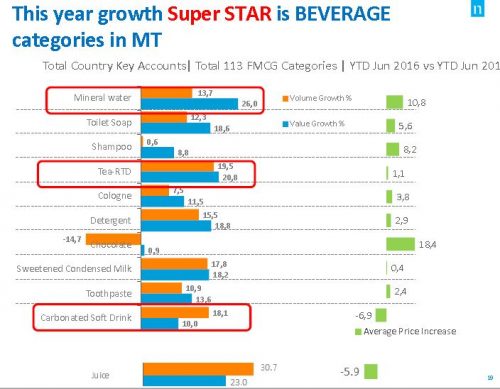
Image above from the Retail trend & marketing strategy 2017 presented by Yongky Susilo. Presentation slides available on Frontier Consulting Group website
Sales performance during Ramadan/Lebaran key barometer
The performance of 2017 will hinge on sales prior to Idul Fitri (Lebaran) festivities. Roy said during an interview with Media Indonesia on 4 July 2017 that sales in the final 10 days leading up to Idul Fitri saw strong growth due to heavy discounting by retailers. Lebaran/Ramadan contributed around 45% towards full year sales. Aprindo expects sales to grow 8% in 2017.


